
This article was written by Wolf Richter and originally published at Wolf Street
For most Americans, housing costs are the largest item in their budget, ranging from 30% to 60% of their total monthly spending. In its Consumer Price Index (CPI) for February, released yesterday, the Bureau of Labor Statistics reported that the costs of homeownership (which the BLS calls “Owner’s equivalent rent of residence”) have increased by just 2.0% from a year ago, and that rents (“rent of primary residence”) have increased by 2.0%. They’re the biggest items among the 211 items in the CPI basket and together account for about one-third of overall CPI. They play a huge role in CPI. So…
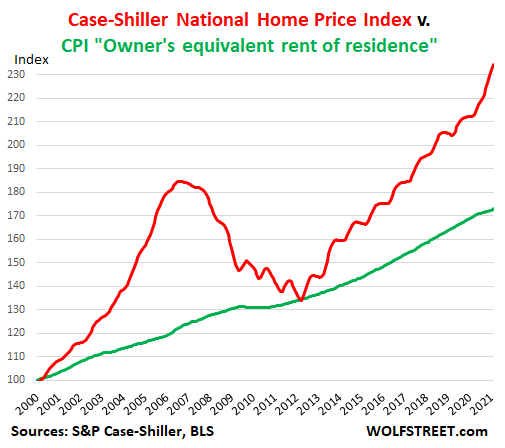
Rent inflation of 2.0% year-over-year on average across the US might be roughly on target, from what I can see in other rental data. But homeowner’s inflation of just 2.0%, given the skyrocketing home prices? Ludicrous. In its latest release, the Case-Shiller National Home Price index jumped by 10.4%.
This discrepancy between home price increases and the CPI for homeowners – which has for years contributed to understating the overall CPI – is depicted in the chart of the Case-Shiller National Home Price Index (red line) and the CPI for “owner’s equivalent rent of residence” (black line). I set the homeowners CPI at 100 for January 2000 to match the Case-Shiller index, which is set by default at 100 for January 2000. This allows you to see the progression of both indices on the same axis.
The thus corrected CPI increases by 3.7%.
The “owner’s equivalent rent of residence” accounts for 24.2% of CPI. If it had increased by 10.4%, in line with the Case-Shiller index, instead of 2.0%, the overall CPI would have increased by 2.03 percentage points more. So add the 2.03 percentage points to the reported overall CPI increase of 1.7%. And the thus corrected overall CPI would have shot up by 3.7%!
During the Housing Bust, after five years of dropping, the Case-Shiller Index briefly joined the CPI for homeowners before taking off again – and there is a reason for that we’ll get into in a moment.
The S&P Case-Shiller Home Price index is a good measure of house price inflation because it is based on the “sales pairs” method, comparing the price of a house when it was sold in the current month, to the price of the same house in prior transactions years ago. It also accounts for improvements and removes outliers. In other words, it measures how many dollars it takes to buy the same house over time – and thereby it measures house-price inflation.
This discrepancy – in reality, a form of purposeful deception – between actual home price increases and the CPI for homeownership has been bemoaned before and is not a secret. But it’s not broadly discussed in the media so that everyone knows by just how much the homeownership component in the CPI understates the actual homeownership inflation that Americans confront.
To its credit, the BLS includes homeownership costs in the CPI basket. By contrast, the EU does not include homeownership costs at all in its basket underlying its Harmonised Index of Consumer Prices (HICP). It only includes rent. And thereby housing costs are woefully underrepresented in the EU’s inflation data.
The rationalization put forth by the BLS for this discrepancy is that it doesn’t actually consider house prices relevant for inflation. It considers houses an “investment,” and investments don’t enter into the CPI. What it does try to put a price on is the cost of “shelter,” which is a service. This makes sense with rent. A renter pays for a service. But the BLS extrapolates this rent-as-a-service to homeownership. And that’s where the logic croaks.
The BLS housing inflation data is based on the “Consumer Expenditure Survey” sent to consumers, rather than market data for prices and rents. It’s up to the homeowner to decide what their primary residence would rent for it they tried to rent it out.
This is the question in the survey: “If someone were to rent your home today, how much do you think it would rent for monthly, unfurnished and without utilities?” So homeowners have to come up with some figure.
For the CPI, the BLS says, the cost of shelter of the owner-occupied home “is the implicit rent that owner occupants would have to pay if they were renting their homes.”
This explains the black line in the chart above that is completely out of tune with the reality of home prices: It tracks rent inflation, not house price inflation, and it essentially represents what homeowners think rents would be. So the rent CPI, which accounts for 7.8% of total CPI, and the homeowner CPI, which accounts for 24.2% of CPI, measure roughly the same thing: rents. And this thereby neatly and purposefully excludes rampant house price inflation from the index. And it also turns CPI into the sad joke that it is.


6 Comments
A bit ago, in an article appearing over at Zerohedge, there appeared analysis of what – functionally – constituted the basis for “Hyperinflation”.
The author’s contention was that the two seperate factors – in tandem – required to set the stage for that occurance was both a vast excess of money in circulation (think M1 here) being openly available in a monetary system but also that there concurrently had to be a high ‘Velocity of Money’…in more daily terms, how frequently money was changing hands.
So, indeed we do already have an enormous amount of the Fed’s Monopoly Money out ‘in the Wild’ so to speak and we are currently on the brink of at least one – possibly two – disbursement(s) of additional cash suddenly finding it’s way into the hands of people who by virtue of Government malfeasance, are rather desperate to receive same and then pay down thier rapidly mounting bills.
It would seem that Brandon’s long-running assertion that the Fed is actively engaged in Assasinating the US Dollar, is now proved perfectly correct. The effects of the currently approved Stimulus package may or may may not be the actual ‘tipping point’ we’ve all dreaded for so long, but certainly, IF the proposed Infrastructure package is subsequently passed, then it’s a near certainty that with all the Pork that accompanies all such that we’ll shortly pass over the edge of the cliff.
Perhaps the motivation is actually equivalent to the Magician faking the audience out with a slight-of-hand (the first Tranche of Cash) then while they’re distracted, issuing the second, very much sub-rosa, filling thier own pockets as well as that of thier cronies before riding off into the Sunset…
I am entirely sure that the current system has utterly no resiliency left upon which to fall back in the event of the unexpected…which I’m equally sure there will be an inordinate amount of presently; witness the rioting now beginning almost as if on cue..
Good Luck everyone…Time is short , use it to best effect.
JOG
The dollar definitely has several big threats facing it while the Fed continues to flood the system with fiat; but the top issue in my view is foreign acceptance of the dollar as world reserve as well as continued foreign investment in dollar denominated debt. My suspicion is that the Fed is going to drive down the dollar’s value to the point that there will no longer be incentive for foreign banks to maintain their holdings. They will get rid of their dollars and the trillions being held overseas will come flooding back into the US. That is a recipe for fast moving price inflation. On top of that, we also have international tensions with countries like China that can easily dump the dollar as world reserve and switch to a basket system like the SDR. Dozens of countries out there would follow their lead and the dollar would collapse. It’s only a matter of when, but it seems to me that the Fed and the government are expediting this process. I agree, I don’t think there is much time left.
Look at whats happening in So Cal. San Diego area. First time homebuyers are priced out of the market even with a budget of $875,000. For the past year plus.
Anything that goes on the market is bought up immediately often by foreigners at over the asking price – that’s one thing thats happening with overseas American dollars.
If all of your assets are financial I think you will be in trouble. Other preps will be necessary and useful. My problem is how to balance the resources I have. How much time we have left makes a difference but no one knows that for sure. I keep reading articles such as this one to help give me some Idea. Alt Market is one of the best sites I go to. Thank you.
Brandon, It seems that the Fed is supporting a strong dollar right now by letting long term interest rates rise. People holding long-term treasuries have to be taking massive losses. But it is also helping suppress the price of precious metals. With the “SilverSqueeze” movement where many average joe’s are buying physical precious metals, it seems the elites are very concerned. How long do you think the Fed will continue to let long-term interest rates rise?
No they aren’t. Long term interest rates are just rising in spite of what the Fed does. Rising rates outside of fed intervention is a consequence of constant inflationary money creation. This does not mean a stronger dollar is on the way, it means the opposite.