

This article was written by Wolf Richter and originally published at Wolf Street
Consumers are starting to run out of artificial steam. The free Pandemic money has been dropping for months and in November nearly faded out. For the first time since April, consumers spent less all around; they spent less on services, nondurable goods, and even on durable goods, which had been spiking in astounding manner.
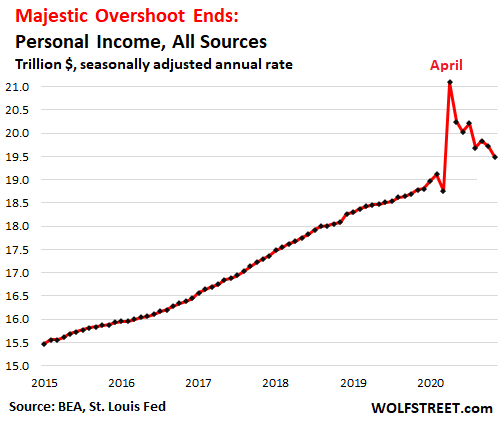
Personal income.
Personal income from all sources in November fell 1.1% from October, to the lowest since March, to a seasonally adjusted annual rate of $19.49 trillion, according to data from the Bureau of Economic Analysis today. It was down 7.6% from its fabulous stimulus-and-extra-unemployment-money-induced spike in April. But it’s still up 3.8% from the Good Times a year ago, now, during the Pandemic when over 20 million people are still claiming state or federal unemployment benefits:
All dollar numbers cited here are “annual rates.” The BEA releases the personal income and spending numbers in form of seasonally adjusted “annual rates.” They extrapolate from the data of the current month what an entire year might look like at this rate, roughly multiplying the number of the current month by 12, plus and minus some adjustments. For example, in 2019, personal income was on average $1.54 trillion per month for an annual total of $18.5 trillion.
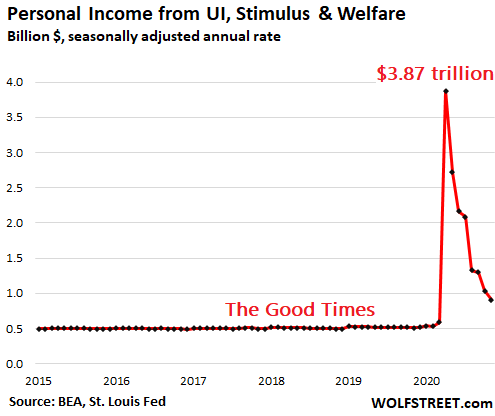
Income from Free Pandemic Money.
Income from unemployment insurance (UI) had exploded from $28 billion (annual rate) in February to $1.40 trillion in June, fueled by the extra $600-a-week in federal unemployment benefits, which expired at the end of July, and by the federal PUA benefits claimed by gig workers. By November, income from UI had plunged down to $277 billion (annual rate), the lowest since March. But it was still about 10 times the Good Times level!
Stimulus payments of the $1,200 per adult and $500 per child for eligible households started pouring into bank accounts in April ($2.9 trillion annual rate that month). The BEA adds these stimulus payments to the relatively steady welfare and other government payments (for short, “welfare payments”), which amounted to around $500 billion (annual rate) during the Good Times. In April, the combined stimulus and welfare payments spiked to $3.4 trillion (annual rate). By November, the stimulus payments had faded, and the combined welfare and stimulus payments dropped to $632 billion (annual rate).
UI, stimulus, and welfare combined, after having spiked to $3.87 trillion (annual rate) in April, dropped to $910 billion in October, the lowest since March, meaning all of the stimulus and extra unemployment benefits, and some of the regular unemployment benefits have ceased:
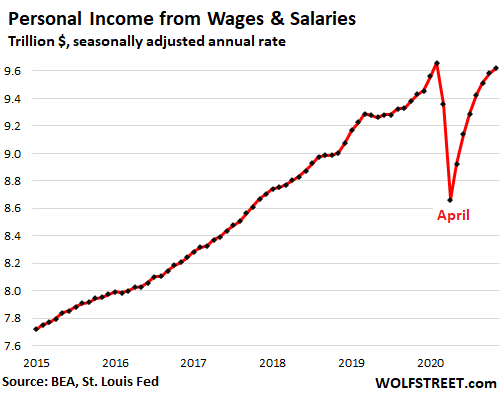
Income from wages and salaries.
As free pandemic money plunged, income from wages and salaries, including from self-employment, ticked up 0.4% in November from October, the smallest month-to-month increase since the plunge in April, to $9.62 trillion (annual rate), down 0.4% from February. But it was up 2.0% from a year ago. This income is “in aggregate,” all earners thrown together into one bucket, including those that have received multi-million-dollar increases in annual incomes:
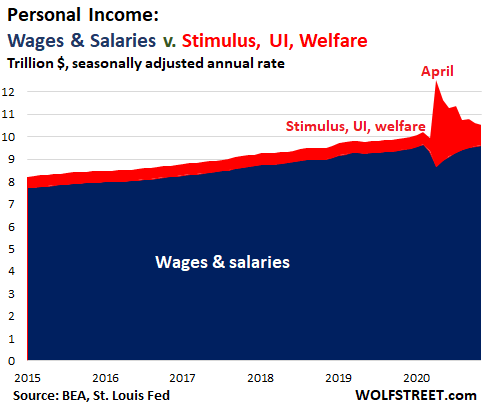
The Majestic Overshoot of Pandemic Money ends.
The stimulus payments and extra unemployment benefits from the federal government under the CARES Act added substantially more in income, starting in April, then the aggregate drop in wages and salaries, and this majestic overshoot is in part what triggered the Weirdest Economy Ever:
Income from other sources, November v. Good-Times February.
Proprietors’ income (farm and nonfarm) in November at $1.77 trillion (annual rate) was about flat with Good Times February, and down $163 billion from October.
Proprietors’ income included $87 billion (annual rate) of free Pandemic-money via the Coronavirus Food Assistance Program for farms and the Paycheck Protection Program loans for farms and nonfarms. This was down from October’s free Pandemic money of $302 billion (annual rate).
Supplements to wages and salaries – employer contributions to employee benefits, pensions, and social insurance – ticked up 0.5% in November from October, to $2.16 trillion (annual rate) and were about flat with Good-Times February.
Interest and dividend income fell by 3.4% from February to $2.87 trillion (annual rate), a result of the Fed’s interest rate repression and corporate dividend cuts.
Rental income ticked up by 0.5% from October, to $819 billion (annual rate) and was up 2.0% from February.
Government transfer payments to persons under Social Security, Medicare, Medicaid, and the Veterans Administration jumped by 5.2% from February to $2.77 trillion (annual rate).
Medicare, Medicaid, and many VA benefits are paid to healthcare providers, but are considered “personal income” because patients are the beneficiaries of the services. The sharp increase in those three since February is partly a function of treating Covid patients:
- Social Security benefits +2.3% to $1.09 trillion (annual rate)
- Medicare payments +6.9% to $860 billion (annual rate)
- Medicaid payments +7.4% to $669 billion (annual rate)
- Veterans’ benefits +7.0% to $147 billion (annual rate).
Spending ticks down across the board.
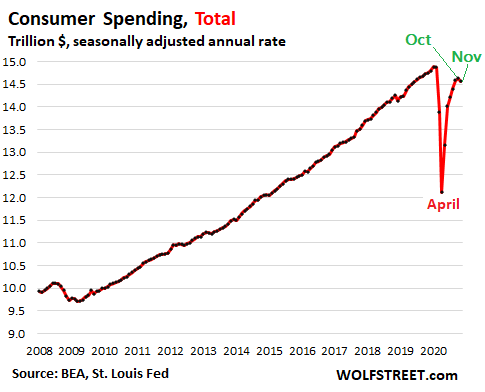
Total consumer spending in November inched down 0.4% from October to $14.57 trillion (annual rate), which was down 2.1% from February and down 1.3% from a year ago. This was the first time since April that consumers backed off on spending, compared to the prior month, with the declines occurring across all three segments – durable goods, nondurable goods, and services. For the 11 months through November, spending is down 2.8%.
Note that none of the spending data is adjusted for inflation, and in some categories, there have been hefty price increases, including an 11% year-over-year increase in used vehicle retail prices.
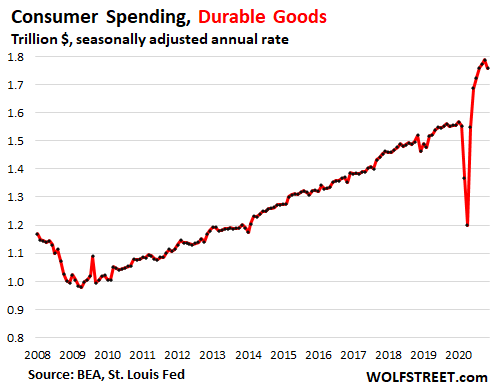
Spending on durable goods backed off a crazy spike for the first time since April, falling by 1.7% in November from October to $1.76 billion (annual rate). But this was still up 13.2% from February and 13.0% from a year ago.
For the 11 months through November, spending on durable goods was up 5.2% from the same period last year, despite the plunge in the spring.
Consumers had spent a portion of the Pandemic money on these goods, such as laptops, smartphones, hot tubs, appliances, bicycles, and new vehicles. Many of these products or their components are imported from China, Germany, Japan, Mexico, etc., and the US stimulus ended up stimulating their economies. Now everyone there is praying that Congress will pass many more big-fat stimulus packages:
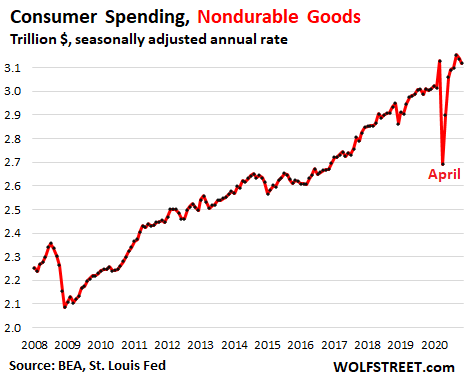
Spending on nondurable goods declined for the second month in a row, in November by 0.6% from October, to $3.12 trillion (annual rate), but was still up 3.4% from February and 3.8% from a year ago. For the 11 months, spending was up 2.1%, despite the plunge in the spring:
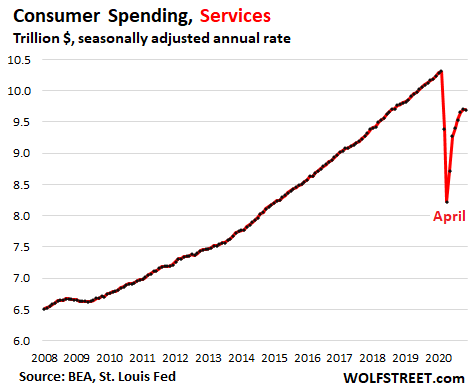
Spending on services – rents, healthcare, insurance, plane tickets, hotel bookings, haircuts, subscriptions such as broadband, cable, and cellphone, etc. – ticked down 0.2% in November from October, to $9.69 trillion (annual rate), the first decline since April, which left it down 6.0% from February. For the 11 months, spending on services was down 5.4%:
In November, services accounted for 66.5% of total consumer spending. Normally services account for 69% to 70%. This is the big shift of consumer spending from services to goods.
Many of the services that consumers routinely bought, such as flights, lodging, and cruises, including to international locations, and tickets to entertainment and sports venues, etc. have been curtailed or shut down during the Pandemic, or consumers don’t feel like buying these services due to the risks. And some of this money not-spent on services got spent on goods.
But November was the first month since April when spending on all three sectors took a step backward from the prior month, as the overshoot of free Pandemic money has started to fade. Consumers in aggregate are still earning more than before the Pandemic, but a lot less than they earned in April, May, and June when gobs of free Pandemic money hailed down on them.
EDITOR’S NOTE: Another issue that needs to be addressed when discussing consumer spending is inflation. Government CPI numbers do not reveal true inflation rates and tend to hide overall price increases in many sectors. For example, official food inflation for 2020 (which is not included in CPI) is around 4%. On top of that, dry bulk foods have nearly doubled in price this year (7 year highs). The pandemic stimulus infusion is dead; it’s over, and it is unlikely that the public will see another one of similar measure anytime soon. Consumer’s ability to spend is falling and at the same time prices are inflating – so, Americans will have less money to spend on increasingly expensive goods. It’s a recipe for stagflationary disaster.


3 Comments
Cost of living increases: There needs to be a CPI-E for the elderly, (drugs and medical care expenses rising). the regular CPI is for younger working people. Senior organizations are useless and do nothing to lobby to get this inacted. All they do is sell stuff magazines, incl. term insurance, travel discounts, etc. which seniors get simply by asking for a sr. discount. Contact your congressman and demand this be passed.
I don’t want congress to pass anything. Less government interference is better. Stop killing people in other countries and save trillions is the right idea. Stop the covid idiot lockdowns and let everyone get back to earning a living. I am retired and expect inflation will make it difficult for me to pay for my own needs but the government should not ‘help’. They are only destructive in everything they do.
Since you are retired also, may retirees you know and I know are on expensive medications (not me or husband taking any), so SS increases for this would be in order. Food, rent in senior apts and elsewhere going up and insurance costs (all types ins.). CPI-E supposedly will be inacted, but again these politicians are all lying scum and few things in our favor ever get passed.